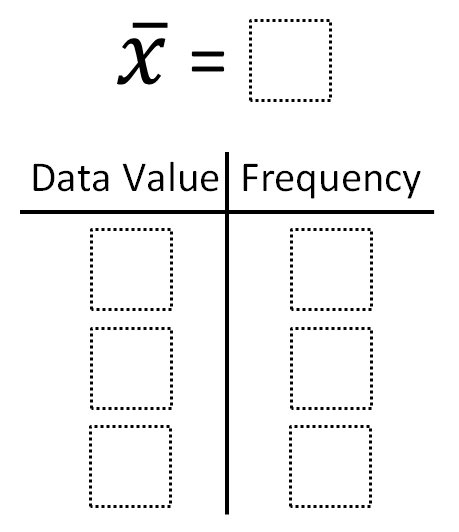
Directions: Using the digits 1 to 9 at most one time each, place a digit in each box to create a frequency table that has the mean in the box at the top.
Hint
Have you thought about what grades you would need to get in a class for the mean to be a desired outcome? For example, if you want a 60 in a class, can you get all 10’s, 20’s and 30’s on assignments?
A second hint I gave was: Do you think it would be easier to choose your mean and work the data to come to that mean or vice versa?
Answer
There is more than one answer to this. My students found at least three. One answer is a mean of 6 with data values of 5 (with a frequency of 3), 7 (with a frequency of 2) and 8 (with a frequency of 1)
Source: Phillip Haislip-Hansberry


I’m not sure the posted answer works? 5(3) + 7(2) + 8(1) = 15 + 14 + 8 = 37 which does not divide by 6.
I had a student who found a mean of 5, from data values of 7 (freq of 8) , 3 (freq of 4) and 1 (freq of 2) that had a mean of 5
I agree that the listed answer is not a correct solution.
One of my solutions was:
*A mean of 7*
With:
Data Value of 9 (freq of 1)
Data Value of 8 (freq of 2)
Data Value of 6 (freq of 4)