Directions: Using the digits 1 to 9, at most one time each, place a digit in each box to represent a data set with:
a. The smallest possible interquartile range, largest possible range, and that is skewed right.
b. An interquartile range greater than 5, range that is greater than 7, and that is skewed left.
Hint
What does interquartile range mean?
If you wanted a range of greater than 6, what are the possible values for IQ1 and IQ3?
If you wanted a range of greater than 6, what are the possible values for IQ1 and IQ3?
Answer
Answers will vary:
a. 1, 2, 3, 4, 9
b. 1, 2, 7, 8, 9
Source: Kerri Swails and Mark Alvaro
Does this exist as a Google Slides version? When I looked, the link to High School > Stats and Probability was blank.
I am working on them right now!
27,28,29,30,31
I teach box plots & IQR in 6th grade. I may try this with them.
This is useful for teaching Algebra 1’s Box and Whisker Plots! Thank you.
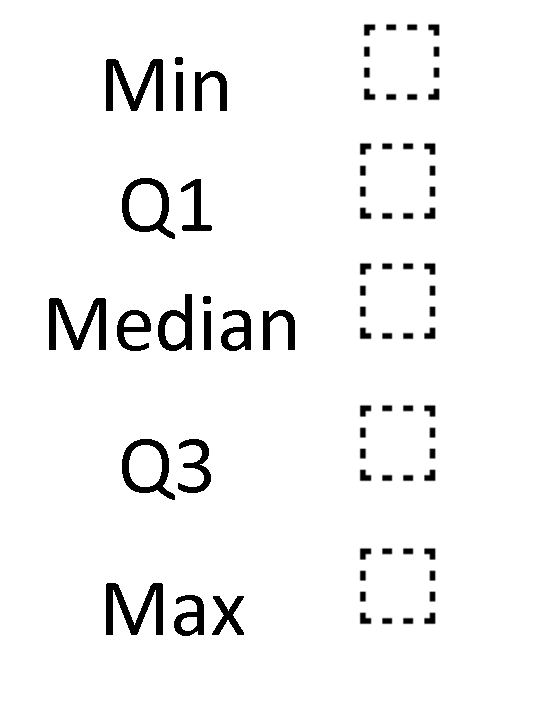
Min is 1
Q1 is 2
Median is 7
Q3 is 8
Max is 9
The answer is 1, 2, 3, 4, 9